
The last two weeks have been crazy. Tons of work and projects, spending time with people I won’t see in the next year, finishing all the paperwork… And in the latest week I moved to Houston with my wife after being waiting for more than one year. So unfortunately I didn’t have enough time to write a new post… until now!
A few days ago I found one of those interesting cases that I love to share with everyone. A poltergeist that took a while to solve. The perfect example that nothing is what it seems. To be honest, I have never seen a performance issue caused by a work process trace…
The problem
A few days ago one of our clients complained about a performance issue related to a Z job in their SAP ERP system. My team started checking the issue and since I was busy at that time I didn’t check the problem. I love performance incidents but to be honest I was busy with other projects so I couldn’t help them. The system info was the following one:
- SAP ERP 6.00 EHP8.
- Oracle 12.2.0.1.0
- SLES 12 SP3.
- Kernel 753 Patch 201.
- Central Instance + DB on same server.
- Running on VMware.
Pretty easy system: no cluster, no multiple instances/servers, all components updated to latest versions, etc. Our client stated that the job execution went from 2500 seconds to 4000 seconds without reason. The job executed a Z program and to be honest I hear the same phrase tons of times before. A few hours later they also told us that there was another hourly job with a higher execution time.
The investigation
So my team started to investigate the issue and they found that the Infrastructure Team moved the VM datastore to a different Data Storage. They did this without telling anyone (sigh) because the operation was supposed to be totally transparent to the SAP System. The performance would be better in the new Data Storage since the disk were SSD instead of HDD. We had the same problem before when moving the datastore to a new Data Storage. I don’t know why but if the SAP System is running at the same time you move the datastore then performance can be impacted. Sometimes it is only necessary to restart the SAP System. Other times it is necessary to generate the database statistics.
The Infrastructure team decided to roll back the operation since out client cannot stop their systems and the database statistics generation take times and they could lock certain tables impacting in the performance and use of the system. It took a couple of hours but when they finished both of the jobs ran slower than expected.
[adinserter block=”7″]
I decided to step in and take a look on the SAP System. First I checked the ST03N to see if the execution times were different. As you can see in the screenshots the Average Response Time was higher but the Average DB Time was quite similar as before:


It is strange since the database response time was almost the same. Usually when there is a problem related to the Data Storage the DB Response Times increased a lot since the IO operations are slower. The interesting thing was that both Processing and CPU times where higher than before. There could be different reasons for this:
- High CPU Times: The obvious reason could be a CPU bottleneck from a high CPU use. It could also be related to a bad IO response times, sometimes when the HDD are not working correctly the OS tries to compensate it using CPU.
- High Processing Time: This could be caused by multiple reasons. For example if there is a WAIT statement in the ABAP code the wait time will be counted as Processing Time. Other reason could be high network times in the communication between the database and the SAP instance (not this case).
So my focus now was to find the reason that both CPU and Processing times were that high. I also checked the Workload Report for Oracle just to make sure that a higher IO wasn’t causing the issue:
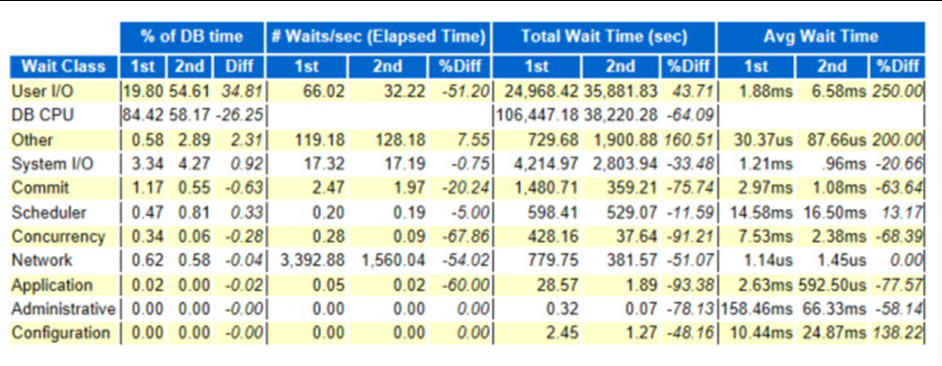
So the User I/O is way higher than before. I checked the timed events and I found that the db file sequential read was higher than before:
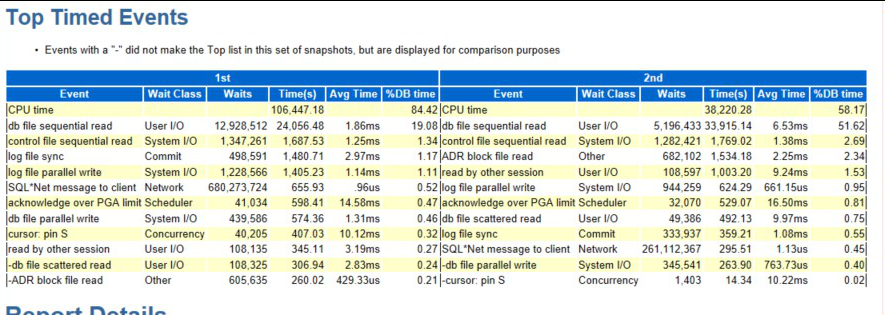
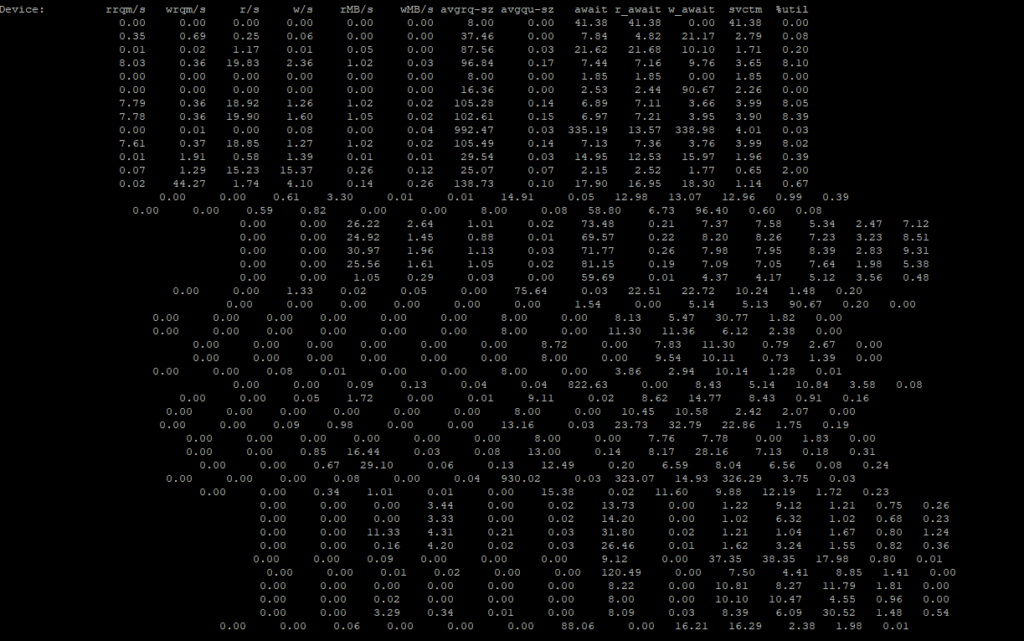
So in the database the User I/O Wait Class is higher than before but the ST03N transaction doesn’t show any different in the DB Response Time. Interesting… I checked the iostat command in the OS but no disk had a high use that could show a IO problem:
I checked the whole system but I couldn’t find anything but a weird color when using the SM50 transaction. The background for each process was yellow instead of the SAP GUI theme color:
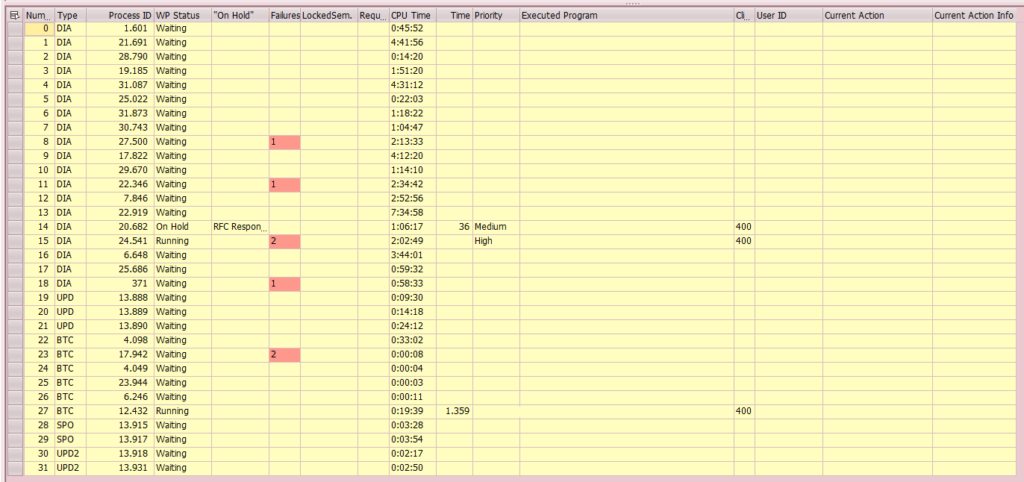
That’s weird… The yellow background only appears when the Work Processes Trace level is above 1. I checked the component trace options in the SM50 (Administration – Trace – Active Components) transaction and I found this:
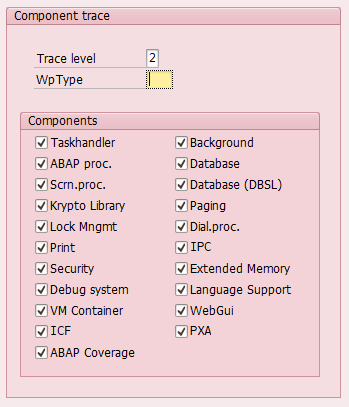
So basically the trace level was activated for all the work processes and all the components. First thing I did was to disabled the Component trace since this could cause a huge impact on the SAP system.
Looking for the smoking gun (aka who activated the work process trace)
After disabling it I tried to find who activated it and when:
- SM20: The security audit was disabled so no luck here.
- ST03N: I found the user who executed the SM50 transaction in the same day the datastore was moved to a new Data Storage. Not really useful…
- SM21: It appears that someone reset the trace files the same day the performance issue appeared. This doesn’t mean that the trace was enabled at that time but sometimes it is related.

[adinserter block=”7″]
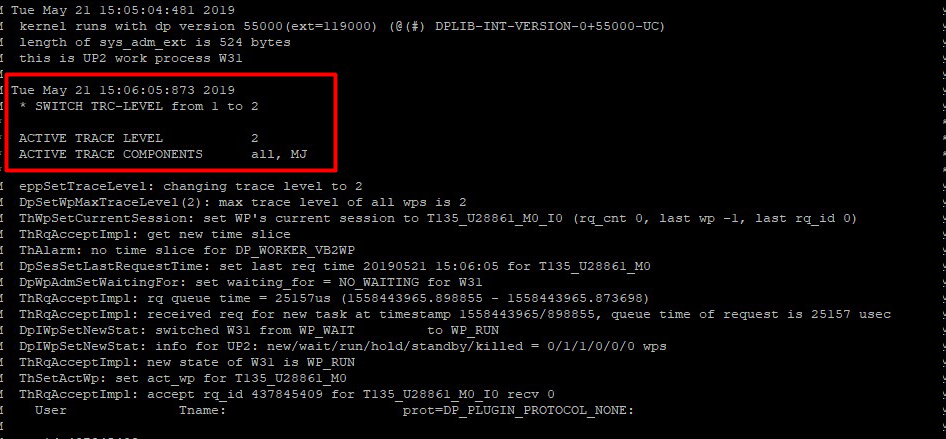
- dev_wX traces files: I found in the work process log files the exact moment when the work process trace was enabled. As you can see in the screenshot each time someone enable the trace for a work process there is an entry showing the changes related to level and trace components.
- RZ20: I also found an alert to a CCMS Node each time the trace was enabled/disabled (sorry, I don’t have a screenshot).
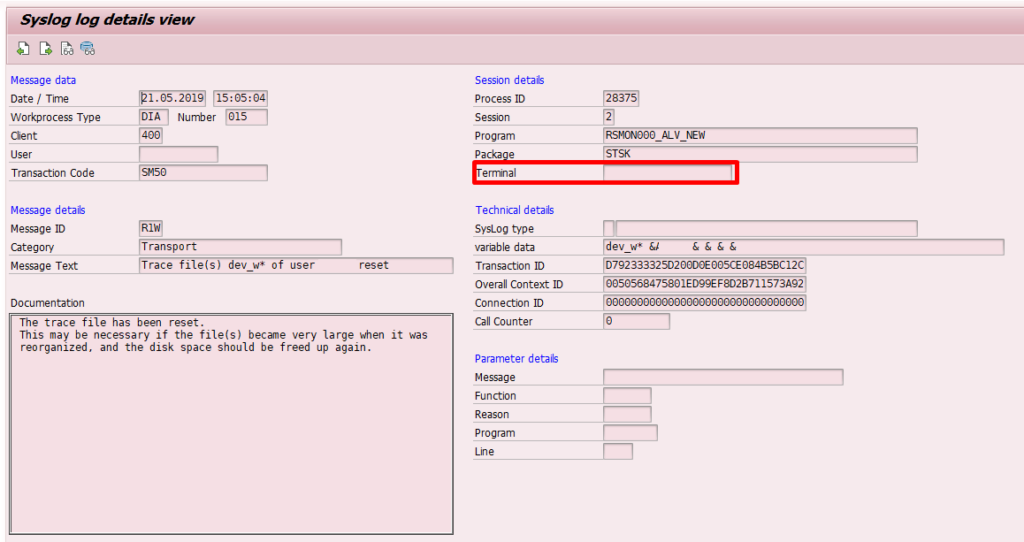
So I knew the user and moment when the trace was enabled but unfortunately the user was a common user used in system administration. Luckily in the SM21 transaction the terminal from where the user was used appeared:
The solution
I checked with our IT department and they give me the employee using that terminal. After checking with him it seems that he enabled the trace on the same day the performance issue appear. Unfortunately he completely forgot to disable it so the trace caused the performance issue.
After disabling the work process trace and reset it to default level the response time for the affected process went back to normal. The issue here is that action performed by the work processes was wrote into the dev_wX trace files with the maximum level of detail. Let’s say you execute a transaction that goes through several steps like the following screenshot:
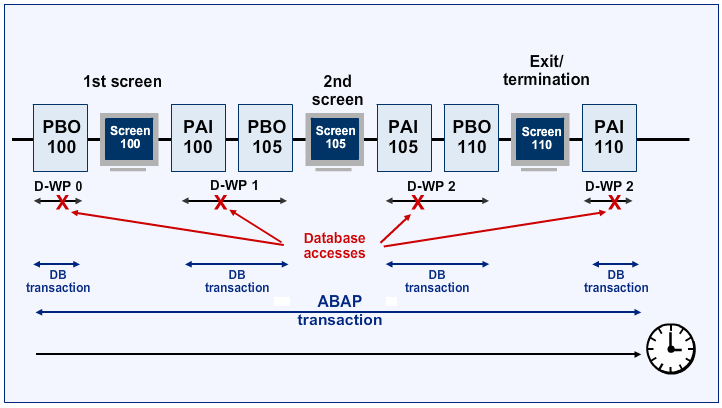
On each of the screen executed by the transaction there are two mandatory steps for each work process: PBO (Process Before Output) and PAI (Process After Input). Both PBO and PAI are related to the same work process so if I enter the input variables and I executed the transaction both PBO and PAI of the same block will be executed by the same work process. If I keep executing the transaction the work process related to my actions could be the same one or a different one. When I execute a transaction the work process varies and it is not always the same.
[adinserter block=”7″]
This is one of the reasons that we don’t need a work process per user logger into the system. If we activate the work process trace for an specific component then the SAP system will first check if the action performed is related to the enabled component. In that case the work process will write in its dev_wX file the information related to the enabled component with the same detail as the trace level we enabled.
In this case the trace level was 2 which is not the highest one but it is quite high. Also the component enable was all components. This causes that for any action performed by the work process it will have to write in the trace file before doing anything. If you multiple this for all the work process within the SAP System then you will have a huge performance issue.