Few weeks ago I wrote a post about a HANA Database using all memory on the server. If you remember I fixed this issue upgrading the HANA version of the database. I was quite surprised when I received an alert saying that 90% of the physical memory was used on the server. So I logged into the server and show this:

Is the HANA monster attacking again?
The investigation
As I did before the first step was to check the top memory consumers on the database. The SAP Note is 1969700 – SQL Statement Collection for SAP HANA if you don’t remember. You can see the top memory consumers on the following image:

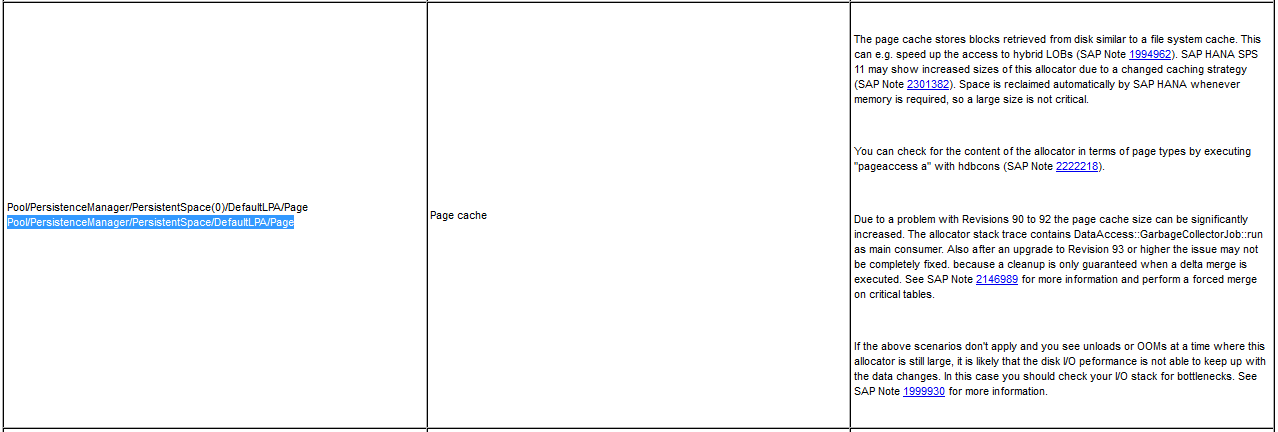
As you can see the aggregator Pool/PersistenceManager/PersistentSpace/DefaultLPA/Page is consuming 38,43GB. This is a lot if we compare it with other aggregators or tables loaded in memory. Next step was to check this aggregate on the SAP Note 1999997 – FAQ: SAP HANA Memory as I did the last time:

It says that it stores blocks retrieved from disk working as it was a file system cached in order to speed up the access to hybrid LOBs. In other words, on SAP HANA SPS11 this was changed and it is working as expected. The HANA Database should release this memory automatically in case it is required so no problem so far.
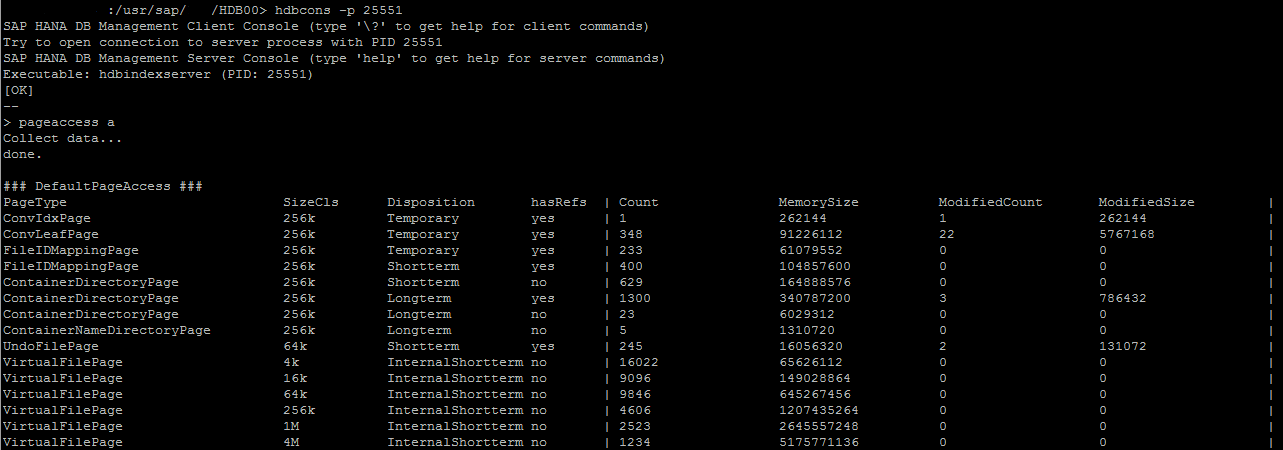
If you want to check the content of this allocator you can use the command page access a with the hdbcons tool as explained in the SAP Note 2222218 – FAQ: SAP HANA Database Server Management Console (hdbcons):

Conclusions
As I said on other post it is really important to investigate and read about an issue before doing anything, specially if we are talking about a production system. If we don’t do it our solution could be worse than the issue. For example, speaking about this example we could unload tables from the HANA database in order to release memory which would be really stupid and it would affect the system performance. Or we could patch the database, wasting time since this is not an issue and it is working as expected.