SAP Java Stacks are quite unknown for people that works in the SAP world. I have to say that I’m not a big fan of SAP Java Stacks/Systems. Some simple tasks that are quite easy to do on ABAP systems get quite difficult and frustrating when working with JAVA systems. Despite of this if you work as a Basis Consultant it is mandatory to know about this type of systems. In this post I will show you how to investigate OutOfMemory (OOM) errors in SAP Java systems.
The problem
In this case the system having the issue was a SAP PO 7.4 running on a Java Stack. This means that there is no ABAP stack as usual in SAP PI/PO systems which run as a Dual Stack. In this case the OOM error caused that the server having the issue completely stopped after the error. If you take a look to the log files on the directory /usr/sap/SID/JXX/j2ee/cluster/serverX/log you would find an error message like this:
|
1 2 3 4 5 6 |
javax.ejb.EJBException: ASJ.ejb.005043 (Failed in component: sap.com/com.sap.xi.mdt2, BC-XI-IS-WKB) Exception raised from invocation of public java.util.ArrayList com.sap.aii.mdt.server.adapterframework.AdapterFrameworkMonitoringBean.getLogEntries(java.lang.String,java.lang.String) throws com.sap.aii.mdt.api.exceptions.OperationFailedException,java.lang.NumberFormatException,java.rmi.RemoteException method on bean instance com.sap.aii.mdt.server.adapterframework.adapterengine.AdapterFrameworkMonitoringBean@2946887a for bean sap.com/com.sap.xi.mdt2*xml|com_sap.xpi.mdt.afmetadata.jar*xml|AFMessageMonitoringBean in application sap.com/com.sap.xi.mdt2.; nested exception is: java.rmi.RemoteException: java.lang.OutOfMemoryError: Java heap space (failed to allocate 536870928 bytes) (max heap: 4096 MB) |
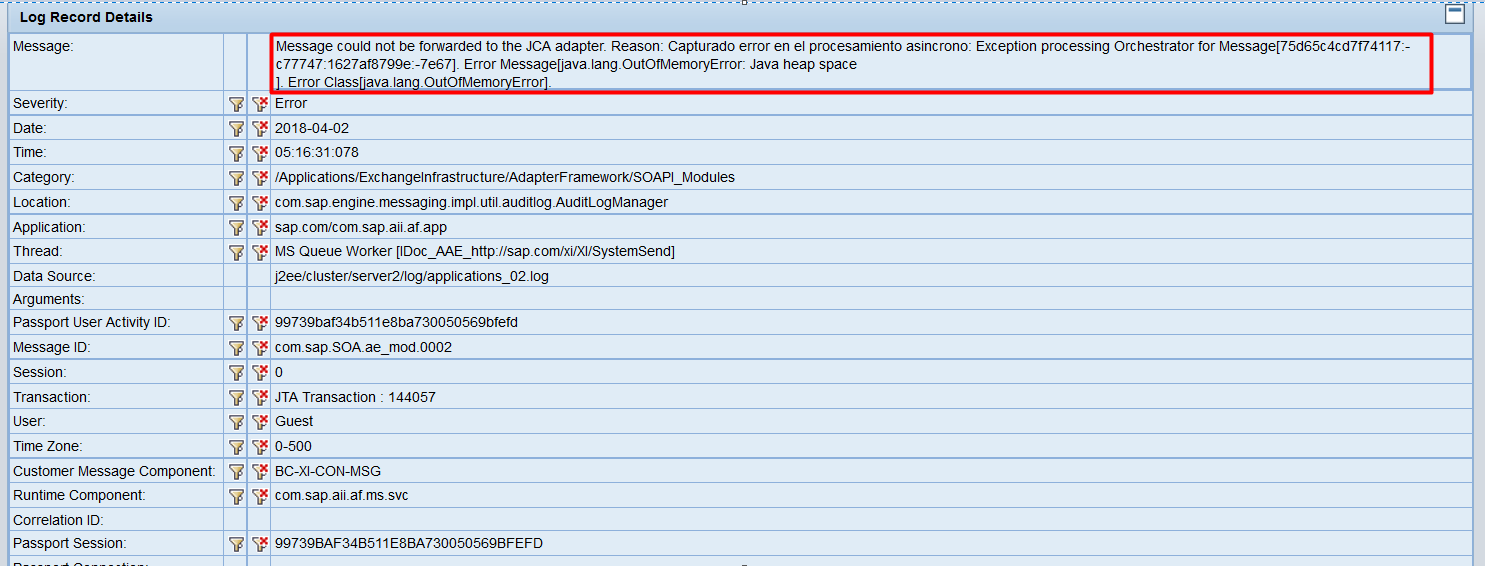
The error message appears in the defaultTrace_00.XX.trc. It is also possible to see it in the log viewer inside the NWA:
After restarting the server and even the SAP PO system the problem appeared again after a while.
The investigation
So the first thought you probably had when having this errors is to increase the memory parameters and see if it works, right? This is wrong and it will only cover the issue. I admit I did it a few times but it is better to spend some time investigating the issue than doing this workaround. When the Java Stack have a OOM error while working it generates a file named OOM.hprof inside the directory /usr/sap/SID/JXX/j2ee/cluster/serverX/log. The first thing you should do is to download this file to study it later. If you try to open this file with a text editor you will see nothing, fortunately Eclipse released a tool for analyzing this files.
Eclipse Memory Analyzer is a tool released by Eclipse as Open Source Project that allows to open OOM.hprof files and investigate inside them. These files shown the state of the memory inside the java server process before crashing. There is an excelled guide of how to work with this program but I’ll show you the basic steps.
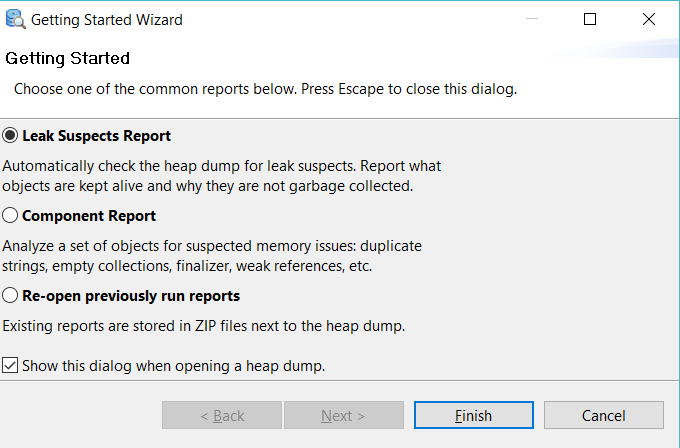
- Open the Eclipse Memory Analyzer and click File – Open Head Dump. Over there select the OOM.hprof file that you downloaded before.
- Leave the first options selected:
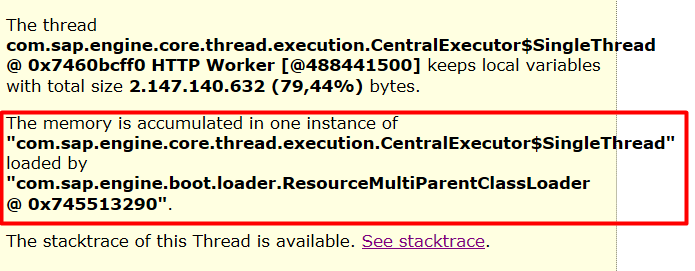
- The application will show the memory leak suspects:
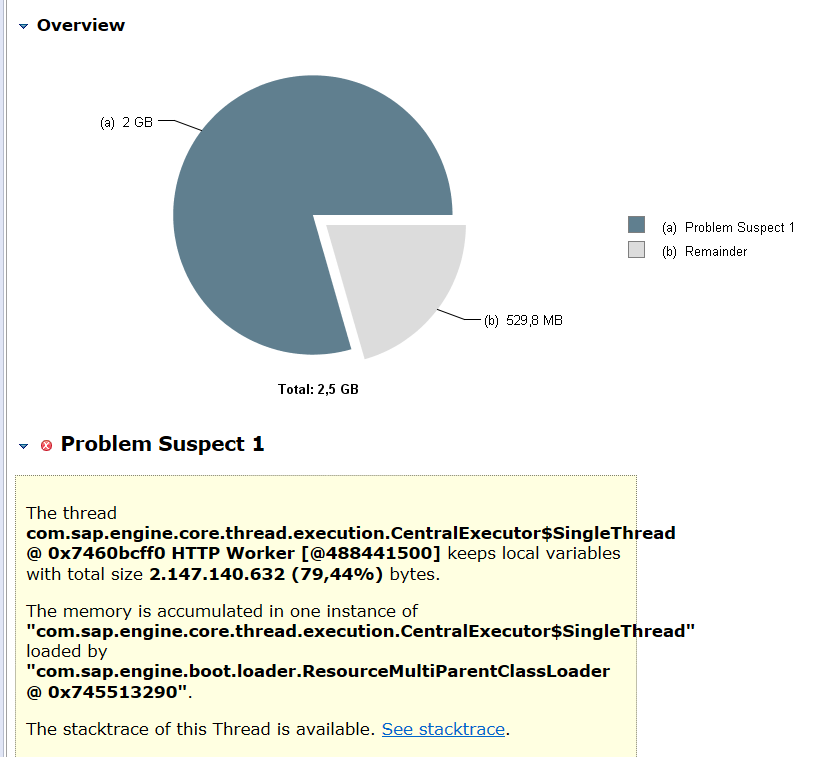
- As you can see in this case the thread consuming 2,5GB is com.sap.engine.core… and the object address is 0x745513290.It is also important to see where the memory is accumulated. It appears in the following part:
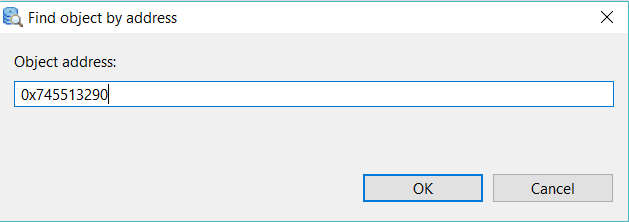
- The next step is to find this memory address inside the OOM.hprof to see what could be causing the memory leak. In the top part you have the option Find object by address:
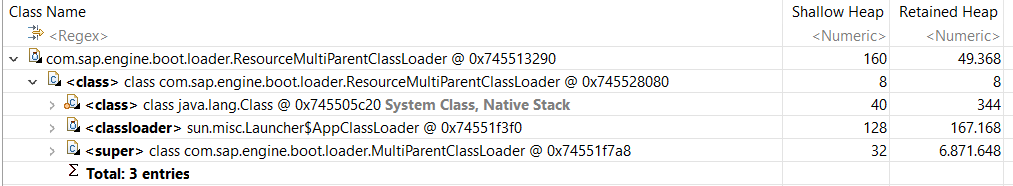
- A new screen opens where we can see some information related to the Class Name such as parent, package, resource, etc.
The solution
The next step is to look in the SAP Support Portal for SAP Notes with this class, check the SCN and Google. Please keep in mind that the instance could be the same one but the instance can change. In this case I look for the class and instance and I found the SAP Note 2217500 – PI OOM: AdapterMessageMonitoring Web Service that points to the SAP Note 1979364 – OOM when calling AdapterMessageMonitoring web service. Please keep in mind that the instance described in the first SAP Note is not the same as the one we have in the Eclipse Memory Analyzer but in my case the solution described worked perfectly and the issue was gone after updating the SAP System to the patch described.
In case you need to increase the heap memory as a workaround you can do it using the SAP Config Tool as described here.